
How underwriters read a marine claims record
Understand paid claims, outstanding reserves, loss ratios and development through a worked marine account, and see why claims history needs operational context.
On this page
A claims record is a dated view of experience, not a final price for the next policy. Paid amounts, outstanding estimates, recoveries, exposure and reporting basis must be read together before a loss ratio or trend becomes meaningful.
What you will learn
- Distinguish paid claims, outstanding estimates and reported incurred amounts.
- Calculate a clearly defined illustrative loss ratio and explain its limitations.
- Assess development, exposure changes and corrective action alongside the figures.
A low paid total can hide a substantial open claim
One vessel account shows little money paid to claimants. Another shows a much larger total. It is tempting to rank the first as the better risk, until its open machinery claim appears: most of the expected payment is still held as an estimate.
A loss record, sometimes called a claims experience record or loss run, shows the claims associated with an account on a stated basis. It can help an underwriter understand previous events, but it is a snapshot. The date, definitions and operation behind the numbers are as important as the total.
This guide follows a simplified marine account. It does not prescribe an insurer’s pricing method or an actuarial reserving model.
Read the headings before calculating a ratio
First establish which assured, vessels, goods or activities the record covers. Then identify the years, currency and valuation date: the date to which the claims information has been brought up to date. A record prepared in June and one updated in October may describe the same claims at different stages.
The reporting basis also matters. An accident-year view groups events by when the loss occurred. An underwriting or policy-year view groups business by the relevant insurance year. A calendar-period financial result can include changes to claims from earlier years. These views should not be combined merely because their columns carry the same calendar label.
Ask how fees, recoveries, deductibles and reinsurance are treated. A figure described as “net” is incomplete without explaining what has been deducted. Regulatory reporting frameworks likewise distinguish gross and ceded figures and require consistent year bases; an underwriting submission needs the same clarity even though it is not that regulatory return.
Paid, outstanding and incurred amounts
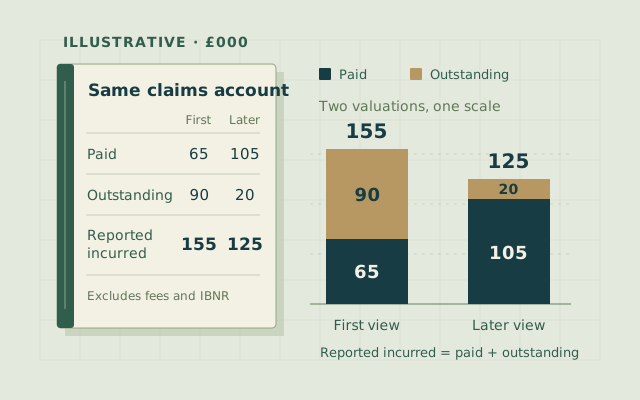
Paid is the amount already paid on the stated basis. Outstanding is an estimate of future payments on an open claim. For a simple cohort of reported claims, reported incurred is paid plus outstanding at the valuation date.
| Term | What it tells the reader | What it does not establish |
|---|---|---|
| Paid | Payments recorded so far | The final cost of an open claim |
| Outstanding case estimate | Expected further payments on a reported claim | An agreed settlement or certainty about the eventual outcome |
| Reported incurred | Paid plus outstanding for the identified claims | Every possible future loss or an ultimate actuarial result |
| Recovery | An amount obtained, or expected, from another source | That an anticipated amount will actually be collected |
An IBNR provision concerns losses incurred but not yet reported, with some reporting conventions also including further development of known claims. It may be assessed separately from an account’s claim-by-claim schedule. A record of known claims should not be presented as including such an allowance unless it actually does.
Worked example: the difference between paid and reported incurred
All figures and claims below are invented. Assume the table covers claims from one completed policy-year account at a common valuation date. Amounts are the insurer’s share after contractual deductibles, before recoveries or reinsurance. For simplicity, fees and IBNR are excluded. Matching earned premium for this account and year is £250,000.
| Claim | Paid | Outstanding | Reported incurred |
|---|---|---|---|
| A: completed repair claim | £50,000 | £0 | £50,000 |
| B: open damage claim | £10,000 | £90,000 | £100,000 |
| C: settled minor claim | £5,000 | £0 | £5,000 |
| Total | £65,000 | £90,000 | £155,000 |
Paid claims divided by the matching premium give £65,000 ÷ £250,000 = 26%. The reported-incurred ratio on the stated basis is £155,000 ÷ £250,000 = 62%. The gap is the open estimate, not an arithmetic disagreement.
A loss ratio generally relates incurred losses to earned premium, but the definition of the numerator still needs attention. Earned premium relates to insurance protection already provided; it is not automatically the same as a cash receipt, a quotation or premium written during an arbitrary period. This example deliberately holds the account, year and premium basis together.
The 62% figure excludes the items expressly left out above. It is not a complete profitability measure: expenses and other financial considerations remain outside this simplified calculation.
Development can change the story without a new incident
Suppose claim B later shows £50,000 paid and £20,000 outstanding. Its reported incurred amount is now £70,000. If the other claims and premium remain unchanged, the account total becomes £125,000, giving 50% on the same simplified basis.
An additional £40,000 has been paid on B, but its expected total cost has fallen by £30,000 because the outstanding estimate changed. Looking only at payments would miss that development. Looking only at the improved ratio might wrongly suggest that a new risk-control measure produced it.
Claims can develop in the other direction too. Later technical findings, legal developments or revised repair estimates may increase the expected cost. A closed status should be read with the report’s conventions; it is not a universal guarantee that no further issue can arise.
Put frequency and severity against the exposure
Five handling claims among 1,000 comparable shipments represent a different observed frequency from five among 500. In this invented comparison, the respective rates are 0.5% and 1%, provided that claims and shipments are counted consistently. A count without its exposure denominator can conceal a change in the business.
Severity asks how much each event costs. A single serious machinery casualty can dominate a small fleet’s results, while frequent smaller claims may reveal a recurring operational weakness. Both deserve explanation. Removing a large event from a presentation because it is inconvenient would hide part of the experience; showing it separately can help explain its effect without discarding it.
The insured operation can also change. More voyages, different cargoes, larger vessels or a higher deductible alter the meaning of a year-on-year comparison. Repair costs and other prices can change the cost of similar events. An apparently stable claims total may therefore sit on a very different underlying exposure.
Connect the incident with evidence of improvement
A useful account narrative identifies what happened, what is known about the cause and which actions followed. Evidence might include completed repairs, changes to a packing design, inspection records or training linked to the particular failure. A proposed procedure and a procedure demonstrably used are different things.
Allow enough context to assess the improvement. One uneventful voyage after a change is less experience than several years of comparable operation. Equally, an adverse claim outcome need not prove that every aspect of the operator’s management is poor. The analysis should explain the connection between evidence and conclusion.
Skuld’s underwriting rules, for example, identify the member’s loss record as one relevant consideration in premium setting. They do not turn it into a universal formula. The prospective exposure, terms, capacity, uncertainty and insurer’s appetite still require judgement.
What to send with the next submission
Supply the dated record with its original basis, explain significant open matters and identify changes to the operation. Keep expected recoveries separate from cash already received. If you prepare an alternative view, such as results on a different deductible, label the assumptions and reconcile it to the original.
The underwriter should be able to follow the reported numbers and understand what may change them. Preparing a marine submission shows how to bring that account history together with the proposed operation and cover. For the separate question of an insurer sharing its own loss exposure, marine reinsurance explained works through quota-share and excess-of-loss examples.
Preparing for P&IQ or ICS?
Build on what you have learned with structured P&IQ and ICS study, question practice and mock exams.
Explore exam preparation